A Quick Note : Locating All Code Blocks Belonging to a (Fragmented) Function with pdbparse
Locating All Code Blocks Belonging to a (Fragmented) Function with pdbparse
I think, the best way to start this post is with a quote from “Undocumented Windows 2000 Secrets” by Sven B. Schreiber:
Normally, a compiler tends to keep the code of a function in a monolithic block, and doesn’t split up if/else branches. In the Windows 2000 kernel modules, however, it can be easily observed that large functions with numerous if/else branches are heavily fragmented. […] My assumption is that this split is supposed to aid the processor’s instruction prefetch. […] If the less frequently executed branches are separated from the more frequently used ones, the CPU can perform more effective instruction prefetch.
Having worked with Windows 10 system libraries for some time now, I can confirm that long functions in them are, too, split into non-adjacent blocks of instructions. Suppose, a task of recovering all such blocks (that belong to a particular function) from a binary module arises. Of course, armed with a good disassembler, one could reconstruct a control flow graph by following the various jump instructions within the function body. For Windows modules, however, seeing that they come with symbol files which often contain information about code fragments/function associations, there is an easier way.
Presently, I am using a python library called pdbparse to extract data from pdb files. Independent of Microsoft’s APIs, it allows to do so under any operating system that runs a python interpreter. In this short post I will show how, given a function name, one could retrieve addresses of all the code fragments comprising this function.
For starters, we must acquire a “reference to a procedure” symbol corresponding to the function in question from the global symbols stream. The “reference to a procedure” symbol will point to the module stream where additional information pertaining to the function can be found. If any of the above sounds like an Auyokawa poetry to you, I suggest looking through this post by yours truly.
Below is an excerpt from hexdump of a module stream that corresponds to the compiland defining ServerDllImplementation() in Windows’s basesrv.dll.
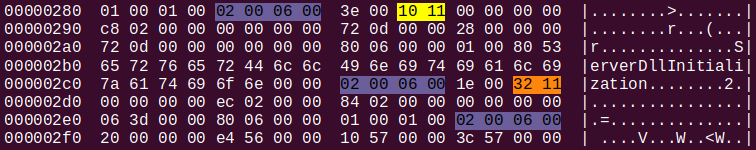
It should look awfully familiar to those who have gotten themselves acquainted with the post I mentioned. Observe the S_GPROC32 = 0x1110 (defined in cvinfo.h) that signifies the beginning of PROCSYM32 structure and the end-of-symbol-block marker 0x00060002. PROCSYM32 could be used to locate the first code segment. Take a look.
1
2
3
4
5
6
7
8
9
10
11
12
13
14
15
typedef struct PROCSYM32 {
    unsigned short  reclen;     // Record length
    unsigned short  rectyp;     // S_GPROC32, S_LPROC32, S_GPROC32_ID, S_LPROC32_ID, S_LPROC32_DPC or S_LPROC32_DPC_ID
    unsigned long   pParent;    // pointer to the parent
    unsigned long   pEnd;       // pointer to this blocks end
    unsigned long   pNext;      // pointer to next symbol
    unsigned long   len;        // Proc length
    unsigned long   DbgStart;   // Debug start offset
    unsigned long   DbgEnd;     // Debug end offset
    CV_typ_t        typind;     // Type index or ID
    CV_uoff32_t     off;
    unsigned short  seg;
    CV_PROCFLAGS    flags;      // Proc flags
    unsigned char   name[1];    // Length-prefixed name
} PROCSYM32;
The pair 〈seg : off〉 refers to an offset withing the PE section (in all probability, .text) where the function’s code resides. However, it will only give us the first fragment. In order to obtain the rest one should look for the S_SEPCODE = 0x1132 marker following the PROCSYM32 structure (and, possibly, some optional debug info related to the current procedure symbol). pEnd indicates where the current PROCSYM32 (and the additional data) ends.
1
2
// Separated code (from the compiler) support
S_SEPCODE       =  0x1132,
Apparently, Microsoft calls such code fragments “separated code” and there could be more than one in the body of a long function.
1
2
3
4
5
6
7
8
9
10
11
12
typedef struct SEPCODESYM {
    unsigned short  reclen;     // Record length
    unsigned short  rectyp;     // S_SEPCODE
    unsigned long   pParent;    // pointer to the parent
    unsigned long   pEnd;       // pointer to this block's end
    unsigned long   length;     // count of bytes of this block
    CV_SEPCODEFLAGS scf;        // flags
    CV_uoff32_t     off;        // sect:off of the separated code
    CV_uoff32_t     offParent;  // sectParent:offParent of the enclosing scope
    unsigned short  sect;       //  (proc, block, or sepcode)
    unsigned short  sectParent;
} SEPCODESYM;
Similarly to the 〈seg : off〉pair, 〈sect : off〉 provides us with the location while the length field tells us where this code fragment ends. Thus, the action plan is as follows:
- Parse
PROCSYM32; - Skip to the end of
PROCSYM32’s block (optional debug info about arguments, local variables, etc); - Locate
S_SEPCODEand, if found, parse the encompassingSEPCODESYMstructure; - If succeeded repeat step 3.
Voilà!
1
2
3
4
5
6
7
8
9
10
11
12
13
14
15
16
17
18
19
20
21
22
23
24
25
26
27
28
29
30
31
32
33
34
35
36
37
GlobalProc = cs.Struct(
    "PROCSYM32" / cs.Struct(
            "reclen" / cs.Int16ul,
            "rectyp" / cs.Int16ul,
            "pParent" / cs.Int32ul,
            "pEnd" / cs.Int32ul,
            "pNext" / cs.Int32ul,
            "len" / cs.Int32ul,
            "DbgStart" / cs.Int32ul,
            "DbgEnd" / cs.Int32ul,
            "typind" / cs.Int32ul,
            "offset" / cs.Int32ul,
            "seg" / cs.Int16ul,
            "flags" / cs.Int8ul,
            "name" / cs.CString(encoding = "utf8"),
    ),
    #the stream starts at ctx._params.entry_offest offset in an input file, whereas ctx.PROCSYM32.pEnd is
    #relative to the beginning of the file; cs.Int32ul accounts for the end-of-sequence marker
    cs.Padding(lambda ctx: ctx.PROCSYM32.pEnd - ctx._params.entry_offest -\
        ctx._io.tell() + cs.Int32ul.sizeof()),
    "sepcodesyms" / cs.GreedyRange(
        "SEPCODESYM" / cs.Struct(
            "reclen" / cs.Int16ul,
            "rectyp" / cs.Const(S_SEPCODE, cs.Int16ul), #range over all records with rectyp = S_SEPCODE
            "pParent" / cs.Int32ul, # pointer to the parent
            "pEnd" / cs.Int32ul,    # pointer to this block's end
            "length" / cs.Int32ul,  # count of bytes of this block
            "scf" / cs.Int32ul,     # flags
            "off" / cs.Int32ul,     # sect:off of the separated code
            "offParent" / cs.Int32ul, # sectParent:offParent of the enclosing scope
            "sect" / cs.Int16ul, # (proc, block, or sepcode)
            "sectParent" / cs.Int16ul,
            cs.Padding(lambda ctx: ctx.pEnd - ctx._params.entry_offest -\
                ctx._io.tell() + cs.Int32ul.sizeof())
        ),
    )
)
So far we managed to obtain offsets in PE sections and, depending on your goals, it might be sufficient. However, if one needs to know functions’ boundaries at all, it is likely as a part of some debugging/binary analysis effort and in this case addresses in the debugee’s address space are of much greater use. To achieve this, I retrieve dll’s preferred base address with the help of pefile library and use section’s virtual address to compute its address in the address space of the process being debugged.
NOTE: Of course, the DLL might be loaded at an address different from its preferred base address; to account for this case one can easily modify the script so that it accepts an additional parameter.
Putting it all together, we get:
1
2
3
4
5
6
7
8
9
10
11
12
13
14
15
16
17
18
19
20
21
22
23
24
25
def list_code_blocks(pdb, base, fname):
    fncs = list(filter(lambda s: s.leaf_type == S_PROCREF and s.name == fname,\
        pdb.STREAM_GSYM.globals))
    if len(fncs) == 0:
        print("There is no S_PROCREF-type reference to",\
            fname, "in the global symbols stream.")
        return

    data = pdb.streams[pdb.STREAM_DBI.DBIExHeaders[\
        fncs[0].iMod - 1].stream].data
    fn = GlobalProc.parse(data[fncs[0].offset:], entry_offest = fncs[0].offset)
    segaddr = pdb.STREAM_SECT_HDR.sections[fn.PROCSYM32.seg – 1]\
        .VirtualAddress + base
    print("Function start:", hex(segaddr + fn.PROCSYM32.offset))
    print("Function end:", hex(segaddr + fn.PROCSYM32.offset +\
        fn.PROCSYM32.len), "( length = ", fn.PROCSYM32.len, ")")

    print("Separated blocks of code:")
    for s in fn.sepcodesyms:
        sectaddr = pdb.STREAM_SECT_HDR.sections[s.sect – 1]\
            .VirtualAddress + base
        print("\t", "Block start:", hex(sectaddr + s.off))
        print("\t", "Block end:", hex(sectaddr + s.off + s.length),\
            "( length = ",  s.length, ")")
        print()
To conclude our little discourse on the subject of separated code, let us, so to speak, demonstrate the method in action.
1
2
3
4
5
6
$ python3 pdb_list_code_blocks.py -p basesrv.pdb -m basesrv.dll -n ServerDllInitialization
Function start: 0x180001680
Function end: 0x1800023f2 ( length =  3442 )
Separated blocks of code:
	 Block start: 0x180004d06
	 Block end: 0x180004f8a ( length =  644 )
For your convenience all relevant snippets of python code are collected in a single script. Enjoy!
– Ry Auscitte
Postscriptum
Update. Recently I came across an article expanding on the subject. Therein, the phonomenon is claimed to be the result of applying the Basic Blocks Tools (BBT), which is a kind of “profile-based optimization”. It is meant to increase “spacial locality of code” by grouping the most often executed branches within a module together so that they fit on a single page, if possible, thereby reducing the process’ working set. The frequency of execution for the code blocks is said to be obtained with the help of a profiler.
Even though I did not research (in any depth) the subject myself, the strategy sounds perfectly reasonable to me.
References:
- Sven B. Schreiber, 2001, Undocumented Windows 2000 secrets: a programmer’s cookbook, Addison-Wesley Longman Publishing Co., Inc., USA.
- Ry Auscitte, On Using pdbparse to Retrieve Type Information from PDB Files
- Information from Microsoft about pdb format
- CodeMachine Inc., X64 Deep Dive