On Using pdbparse to Retrieve Type Information from PDB Files
Preface
Recently a need arose for a method of extracting function prototypes from Microsoft pdb files, a method that could be used under Linux, preferably, in a form of a python script. As I had already been using Brendan Dolan-Gavitt’s python library for parsing pdb files, all that needed to be done was to extend it with the code that would handle prototype-related information. While I was on it, I added retrieving global variable declarations and structure definitions to the pile. This post walks you through the steps I took in order to reverse pdb file format and suggests one of possible implementations. That said, provided here is not a complete implementation, but merely a demonstration that is intended to assist in getting you started should you face a similar task. This is also the reason why I decided against submitting a pull request to the pdbparse repository on github. Without further ado, let us begin.
NOTE: Anyone who believes that the source code is better than a thousand words documenting it, may proceed straight to the implementation by clicking this link.
Introduction
According to Wikipedia, Program Database (PDB) is a proprietary file format developed by Microsoft for storing debugging-related data such as types, variable names and addresses, tables linking binary instructions to line numbers within source files, etc. This data is extracted from the source code and at the stage of linking is packed into a file with the same name as that of the executable (an application or dynamic-link library) being built and .pdb extension (unless specified otherwise by the compiler and linker options). Such files are often referred to as “symbol files”.
Proprietary the format may be, but having existed for a very long time, it prompted somewhat substantial reverse-engineering effort: notably, Sven Schreiber describes the earlier version of PDB in his “Undocumented Windows 2000 Secrets”, then, there are a few parsers implemented either as a standalone library or part of a software package. Finally, five years ago Microsoft made the code that created PDB files open-source (partly), hence one might argue whether the format could still rightfully be called proprietary.
I suggest browsing through the links collected by Krzystof Kowalczyk in his “pdb format” post before delving into inner workings of symbol files. Articles on the subject by Oleg Starodumov also come as highly recommended. I will only reiterate a few points of interest found in the referenced material:
- A symbol file consists of an arbitrary number of separate (independent) streams that could be thought of as files within a file. At a lower level, each stream is further subdivided into pages of fixed size (usually 4 KB), such that a steam could occupy a non-continuous region within the symbol file, with pages from various steams mixed together. This structure is similar in nature to that of NTFS files and allows for multiple independent writers operating simultaneously.
- At a higher level, the stream is continuous and consists of records, each adhering to the following format:〈record length〉〈record type〉〈record body〉, so that a parser, armed with information about lengths and types, could safely skip the records it does not understand. As Schreiber notes, this record structure was inherited from the ancient OMF format for 16-bit DOS object files.
- In a PDB file, there is a set of predefined streams carrying out specific functions. Among them are PDB, Debug Info (DBI), Types Info (TPI), and Global Symbols streams. Some of these streams are identified by a fixed index, while indices of others vary from file to file and are stored in headers. PDB stream holds information necessary for matching the symbol file to the executable for which it was generated as well as flags that determine what features are included in the pdb. DBI stream provides information about compilands (object files) linked together to generate the resulting executable and the corresponding source files. TPI stream contains type definitions other streams reference by index. Finally, Global Symbols stream lists symbols visible across boundaries of object files (so-called “symbols with linkage”) such as global variables. More info on stream types can be found here.
There is one more thing I ought to mention before proceeding. Working with symbol files, one is likely to encounter a pitfalls: the type of information contained therein depends on the version of development toolchain that generated it (the way debug information is stored has undergone major changes over the years) and the compiler/linker settings used to omit/include data in a an adjustable manner, which may “break” some parses. This concerns my code as well. You have been warned.
Important Version Information
Listed below are the versions of pdbparse and its dependencies that I have installed on my computer. For obvious reasons, this post may be irrelevant for other (earlier or later) versions of pdbparse. One hopes that in the near future some benevolent soul will donate code extending the library with the missing functionality thereby rendering everything written here perfectly useless. Wink-wink.
1
2
3
4
5
6
$ pip3 list
Package                Version
---------------------- -------------
construct              2.9.52
pdbparse               1.5
pefile                 2019.4.18
The Running Example
An undocumented file format (especially as rich in features as PDB) may look like a tangled mess with neither heads nor tails discernible therein. One needs something small and easily manageable for the purposes of reverse engineering so I used Visual Studio to create a simple console application. Here is the source code:
1
2
3
4
5
6
7
8
9
10
11
12
13
14
15
16
17
18
19
20
21
22
#include "stdafx.h"
#include <windows.h>

#define MAX_LEN 255

struct TextHolder {
    WCHAR szBuffer[MAX_LEN];
    DWORD dwLen;
} g_Message;

DWORD store_message(TextHolder* pBuf, LPCWSTR szMessage)
{
    DWORD dwMaxLen = sizeof(TextHolder::szBuffer) / sizeof(TextHolder::szBuffer[0]);
    wcscpy_s(pBuf->szBuffer, dwMaxLen, szMessage);
    return (pBuf->dwLen = wcslen(szMessage));
}

int main()
{
    store_message(&g_Message, L"Hello, World!");
    return 0;
}
This program is simple enough for it to require no explanation so let us go ahead and build it. As far as symbol file generation is concerned, the development environment that I am using (VS 2015) offers three options: Program Database for Edit And Continue (/ZI), Program Database (/Zi), C7-compatible (/Z7) – as well as some additional tweaks such as excluding specific symbols. If you wish to learn more about these options I suggest reading Microsoft’s documentation and this article on DebugInfo.com, however for our purposes it does not matter which (of the three available) debug information format you choose – the result will be the same regardless.
VS2015 comes with the development toolchain version 14 as evident from the PE header of the resulting executable:
1
2
3
4
5
6
7
8
9
10
11
12
13
> dumpbin /HEADERS C:\Temp\hiworld\x64\Debug\hiworld.exe
[...]
OPTIONAL HEADER VALUES
             20B magic # (PE32+)
           14.00 linker version
[...]
  Debug Directories

        Time Type        Size      RVA  Pointer
    -------- ------- -------- -------- --------
    5F877495 cv            3E 0000A868     8E68    Format: RSDS, {0EA205FF-0047-41E8-BAC5-FDA9FFCFB69E}, 1, C:\Temp\hiworld\x64\Debug\hiworld.pdb
    5F877495 feat          14 0000A8A8     8EA8    Counts: Pre-VC++ 11.00=0, C/C++=35, /GS=35, /sdl=0, guardN=33
[...]
Observe the value stored in linker version field. Also worth our attention is the data stored in debug directories where one can find a pair 〈guid, age〉 used to match the executable to the corresponding symbol file and a path to .pdb file. For the sake of completeness, let us take a look at the PDB headers obtained with pdbparse:
1
2
3
4
5
6
7
8
9
Python 3.8.2 (default, Mar 13 2020, 10:14:16)
[GCC 9.3.0] on linux
Type "help", "copyright", "credits" or "license" for more information.
>>> import pdbparse
>>> pdb = pdbparse.parse("hiworld.pdb")
>>> pdb.STREAM_PDB.Version
20000404
>>> pdb.signature
b'Microsoft C/C++ MSF 7.00\r\n\x1aDS\x00\x00\x00'
Notice the letters “DS” present in the signature; the same letters also appear in the format name (“RSDS”) dumpbin gave us. They identify the format for storing debug information in this particular file. As it was already mentioned, the way debug information is stored has gone though metamorphosis and other changes of various magnitudes over the years; for example, what described in “Undocumented Windows 2000 Secrets” is actually the earlier format denoted by the string “JG” and named “Microsoft C/C++ program database 2.00” (see Jeremy Gordon’s post for details).
Now that the exact tools used have been established to ensure reproducibility of results it is time to introduce modifications into pdbparse.
Temporary Workarounds
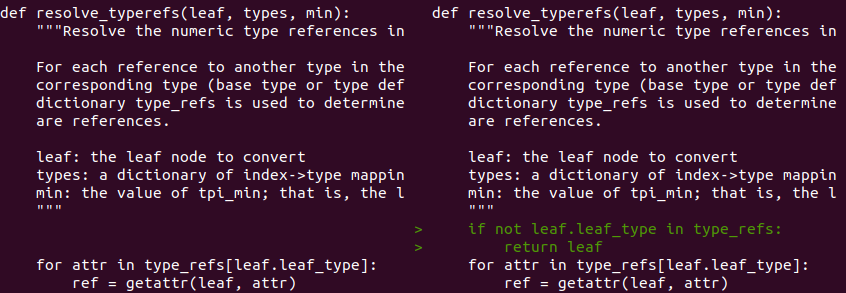
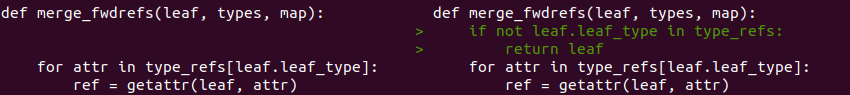
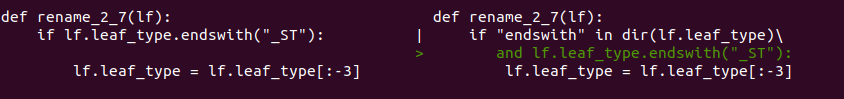
Right off the bat, pdbparse threw an exception when trying to load hiworld.pdb. Evidently, enum leaf_type has some of the constants missing and when these unaccounted for values are parsed, in place of the expected contruct.Enum, a regular integer is created. It certainly looks this way, however, I chose not to look into the problem this time opting out for a temporary fix (a hack if you will) instead. Below are screenshots of terminal screen after running diff --color -y -W 100 /usr/local/lib/python3.8/dist-packages/pdbparse/tpi.py tpi.py
Not a workaround, but a minor fix for an operator precedence issue:
1
2
3
4
5
$ diff /usr/local/lib/python3.8/dist-packages/pdbparse/dbi.py dbi.py
160c160
< Name = "Name" / CString(encoding = "utf8").parse(Names[NameRef[j]:])
---
> Name = ("Name" / CString(encoding = "utf8")).parse(Names[NameRef[j]:])
With these tiny fixes in place, pdbparse has successfully loaded and parsed our subject, hiworld.pdb.
A sensible practice that ensures one avoids inflicting an injury (to one’s ego) is starting with a warmup, which in this case would be implementing something simple, something that does not require alterations in pdbparse’s code. Such are the tasks of reading structure definitions and declarations of global variables.
Structure Definitions and Global Variables
Types are defined in a TPI stream (located inside the .pdb file) and indexed by 16-bit integer keys. Memory layout of corresponding TPI record varies depending on what the type is: an array, structure, union, pointer to another type, and so on. I made extensive use of python’s dir() function to examine internal organization of various types, one by one. Like so:
1
2
3
4
>>> f = filter(lambda t: pdb.STREAM_TPI.types[t].leaf_type == "LF_ARRAY",
...  pdb.STREAM_TPI.types)
>>> list(filter(lambda s: not s.startswith("_"), dir(pdb.STREAM_TPI.types[next(f)])))
['clear', 'copy', 'element_type', 'index_type', 'items', 'keys', 'leaf_type', 'length', 'name', 'pop', 'popitem', 'search', 'search_all', 'size', 'tpi_idx', 'update', 'values']
Here a record for an array declaration is searched for (I know for a fact there is one because TextHolder has an array as one of its fields) and its attributes, omitting those starting with an underscore, are listed. Take a note of the attribute named “element_type” that, in all probability, refers to the type of this array’s elements.
In this manner, types reference other types as theirs constituents, thereby forming a directed acyclic graph (DAG) with its edges embodying the references and vertices – the types themselves (notably, there are exceptions to this rule as pointed out in the LLVM documentation, but I will not elaborate on it). Thereby, a human-readable name for some type might be formed by a function that traverses the DAG recursively, akin to the one below.
1
2
3
4
5
6
7
8
9
10
11
12
13
14
15
16
17
18
19
20
def get_type_name(tp):
    #a primitive type does not have a record
    if not "tpi_idx" in dir(tp):
        return str(tp)
    #for structures and unions, just print out the name
    if tp.leaf_type == "LF_UNION" or tp.leaf_type == "LF_STRUCTURE":
        return tp.name
    #a pointer to a known type
    if tp.leaf_type == "LF_POINTER":
        return get_type_name(tp.utype) + "*"
    #handling 'const', 'volatile', and 'unaligned' modifiers
    if tp.leaf_type == "LF_MODIFIER":
        s = [ mod for mod in ['const', 'volatile', 'unaligned']\
              if tp.modifier[mod] ]
        return " ".join(s) + " " + get_type_name(tp.modified_type)
    #only 1D arrays are supported
    if tp.leaf_type == "LF_ARRAY":
        return get_type_name(tp.element_type) +\
               "[" + str(int(tp.size / base_type_size[tp.element_type])) + "]"
    return "UNKNOWN"
Of course, this is only a toy example; in real life one has to take care of many more technical details. Now that we know how to obtain type names, printing out a structure definition becomes easy:
1
2
3
4
5
6
7
8
9
10
11
12
def print_struct_definition(pdb, sname):
    tps = list(filter(lambda t: \
                      pdb.STREAM_TPI.types[t].leaf_type == "LF_STRUCTURE"\
                      and pdb.STREAM_TPI.types[t].name == sname,\
               pdb.STREAM_TPI.types))
    if len(tps) == 0:
        print("Structure", sname, "is not defined in the tpi stream.")
        return
    print("struct", sname, "{")
    for f in pdb.STREAM_TPI.types[tps[0]].fieldlist.substructs:
        print("\t", f.name, ":", get_type_name(f.index))
    print("}")
Given that obtaining a definition merely understandable by human beings rather than one that would comply with C++ syntax (the latter requiring a little more effort) was my goal, the implementation is simple enough. Let us try it out!
1
2
3
4
5
>>> print_struct_definition(pdb, "TextHolder")
struct TextHolder {
	 szBuffer : T_WCHAR[255]
	 dwLen : T_ULONG
}
The task of printing out a global variable declaration is equally undemanding. For a global variable, it being visible across module boundaries, one would expect to find a matching symbol in the Global Symbols stream. Let us see.
1
2
3
>>> print(*[ ( hex(s.leaf_type), s.name) for s in pdb.STREAM_GSYM.globals\
...  if "name" in dir(s) and "g_Message" in s.name ], sep="\n")
('0x110e', '?g_Message@@3UTextHolder@@A')
Residing among symbols is a variable name conveniently decorated with the type of this variable. Symbol decoration (aka symbol mangling) is a technique of passing type information to linker for semantic error checking and, of course, it is possible to extract this type information from the mangled name.
1
2
3
4
>>> from pdbparse import undname
>>> undname.undname("?g_Message@@3UTextHolder@@A",\
...  flags = undname.UNDNAME_COMPLETE)
'struct TextHolder g_Message'
Here you go. This is the variable declaration you were looking for. I told you it was a piece of cake. Well, not exactly. The problem is that the mangling schemes have not been standardized and, therefore, are compiler-dependent; what is more, decorated symbols might not be present in the .pdb file at all. We need another way.
By the bye, I remember stating, rather boldly, that printing out variable declarations did not require introducing any modifications to the pdbparse’s source code. I, in all my viciousness, deceived you, my trusting reader, as you shall soon see. But all in good time.
1
2
3
4
5
6
7
8
>>> f = list(filter(lambda s: "name" in dir(s) and "g_Message" in s.name,\
... pdb.STREAM_GSYM.globals))
>>> list(filter(lambda s: not s.startswith("_"), dir(f[0])))
['clear', 'copy', 'items', 'keys', 'leaf_type', 'length', 'name', 'offset', 'pop', 'popitem', 'search', 'search_all', 'segment', 'symtype', 'update', 'values']
>>> f[0].symtype
0
>>> hex(f[0].leaf_type)
'0x110e'
The first thing that caught my attention was the lack of reference to the TPI stream. Take a look at the list of symbol’s attributes: segment and offset, most likely, point to the variable’s location in memory and the rest is irrelevant (“symtype” looked promising, but it turned out to be something else). Actually, this is a so-called public symbol, as specified by its record type (0x110e), and its structure is, in fact, documented in Microsoft’s open-source project. The file /include/cvinfo.h is where one should look for relevant definitions.
1
2
3
4
5
6
7
8
9
10
11
12
13
14
15
//Symbol definitions
typedef enum SYM_ENUM_e {
// […]
    S_PUB32 = 0x110e, // a public symbol (CV internal reserved)
// […]
};

typedef struct PUBSYM32 {
    unsigned short  reclen;     // Record length
    unsigned short  rectyp;     // S_PUB32
    CV_PUBSYMFLAGS  pubsymflags;
    CV_uoff32_t     off;
    unsigned short  seg;
    unsigned char   name[1];    // Length-prefixed name
} PUBSYM32;
Indeed, public symbols did not reference TPI stream, but some other symbols must have done, and I decided to look for them. To start with, I needed to know the index of the global symbols stream.
1
2
>>> pdb.STREAM_DBI.DBIHeader.symrecStream
8
Then I employed pdbparse’s pdb_dump utility to dissect the symbol file into constituent streams and ran a search for the string of interest.
1
2
3
4
$ pdb_dump.py hiworld.pdb
$ strings hiworld.pdb.008 | grep g_Message
?g_Message@@3UTextHolder@@A
g_Message
Aha! There is an undecorated version of the variable g_Message hidden somewhere in the symbol stream; however, pdbparse somehow skips the data pertaining to it when parsing the stream. A quick glance inside the source code gives us an insight into why it happens:
1
2
3
4
5
6
7
8
9
10
11
12
13
14
15
16
17
18
19
20
21
22
23
24
25
gsym = Struct(
    "leaf_type" / Int16ul, "data" / Switch(
        lambda ctx: ctx.leaf_type, {
            0x110E:
            "data_v3" / Struct(
                "symtype" / Int32ul,
                "offset" / Int32ul,
                "segment" / Int16ul,
                "name" / CString(encoding = "utf8"),
            ),
            0x1009:
            "data_v2" / Struct(
                "symtype" / Int32ul,
                "offset" / Int32ul,
                "segment" / Int16ul,
                "name" / PascalString(lengthfield = "length" / Int8ul,\
                                      encoding = "utf8"),
            ),
        }))

GlobalsData = "globals" / GreedyRange(
    Struct(
        "length" / Int16ul,
        "symbol" / RestreamData(Bytes(lambda ctx: ctx.length), gsym),
    ))
Pdbparse parses streams with the help of construct library which enables doing so in a declarative fashion. The stream is processed in chunks of ctx.length sizes (see RestreamData()); records for two types of symbols (S_PUB32_ST = 0x1009 and S_PUB32 = 0x110e) only are being recognized and parsed fully, the rest are stored as pairs 〈length, leaf_type〉. Let us see which types of symbols, among present in our file, the parser has missed.
1
2
>>> set([  hex(s.leaf_type) for s in pdb.STREAM_GSYM.globals ])
{'0x1108', '0x1107', '0x110c', '0x110e', '0x1125', '0x110d', '0x1127'}
Or in terms of Microsoft’s implementation:
1
2
3
4
5
6
7
8
9
10
11
12
//Symbol definitions
typedef enum SYM_ENUM_e {
// […]
    S_CONSTANT =  0x1107,  // constant symbol
    S_UDT = 0x1108,  // User defined type
    S_LDATA32 = 0x110c,  // Module-local symbol
    S_GDATA32 = 0x110d,  // Global data symbol
    S_PUB32 = 0x110e, // a public symbol (CV internal reserved)
    S_PROCREF = 0x1125, // Reference to a procedure
    S_LPROCREF = 0x1127, // Local Reference to a procedure
// […]
};
Of these, the symbol denoted by the S_GDATA32 (global data symbol) type appeared to be precisely what I was looking for so I found a matching structure (DATASYM32) in cvinfo.h and augmented pdbparse with an appropriate declaration:
1
2
3
4
5
6
7
8
9
10
11
12
13
gsym = Struct(
    "leaf_type" / Int16ul, "data" / Switch(
        lambda ctx: ctx.leaf_type, {
#[…]
            0x110d: #adapted from struct DATASYM32 in cvinfo.h
                "datasym" / Struct(
                "typind" / Int32ul,
                "offset" / Int32ul,
                "segment" / Int16ul,
                "name" / CString(encoding = "utf8"),
            ),
#[…]
        }))
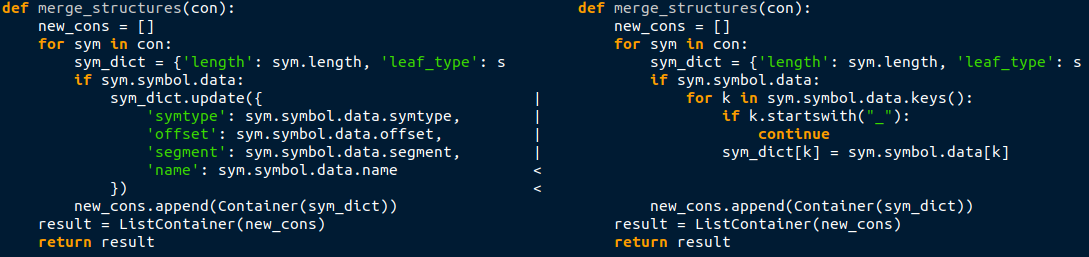
Notice the typeind field! It is the very reference to a record in the TPI stream this entire endeavor was aiming to obtain. A small modification (shown below) to the function responsible for post-processing of symbols list, necessary now that symbols of different types had different sets of attributes, and I was good to go.
Having completed all the preparatory work, I can finally bestow upon you a function that prints out a declaration statement for any global variable. Lo and behold!
1
2
3
4
5
6
7
8
9
10
11
12
def print_variable_declaration(pdb, vname):
    for s in pdb.STREAM_GSYM.globals:
        if not "name" in s or s.name != vname:
            continue
        if not "typind" in s:
            print("Found a symbol named", vname,\
                  "but, it did not have an associated type.")
            continue
        print(get_type_name(pdb.STREAM_TPI.types[s.typind]), " ",\
              vname, ";", sep = "")
        return
    print("Could not find variable", sname)
This time it will actually work reliably. Check it out!
1
2
>>> print_variable_declaration(pdb, "g_Message")
TextHolder g_Message;
Function prototypes
Phew! That was a rather lengthy discourse. My only hope that it left us better prepared for what is to come.
To begin with, I will demonstrate the simplest (but not always reliable) technique based on undecorating. It works just as it did in the case of global variables. There is nothing new here.
1
2
3
4
5
6
7
>>> from pdbparse import undname
>>> print(*[ ( hex(s.leaf_type), s.name) for s in pdb.STREAM_GSYM.globals\
...  if "name" in dir(s) and "store" in s.name ], sep="\n")
('0x110e', '?store_message@@YAKPEAUTextHolder@@PEB_W@Z')
>>> undname.undname("?store_message@@YAKPEAUTextHolder@@PEB_W@Z",\
...  flags = undname.UNDNAME_COMPLETE)
'unsigned long __cdecl store_message(struct TextHolder * __ptr64,wchar_t const * __ptr64)'
Having taken on the task of retrieving function prototypes, I faced a fundamental philosophical problem :-). We expect a one-to-many “is-a” relationship between some type and instances of this type; moreover, the type is usually identified by its name, whereas the instance may or may not be given a name (an identifier) and this name is independent of that of its type. Where functions are concerned (function pointers and interfaces aside) this rule does not hold, however. Long story short, TPI records for functions do not contain names thereby making it impossible to locate a prototype by simply enumerating TPI records.
1
2
3
4
5
6
7
8
for t in pdb.STREAM_TPI.types:
    if pdb.STREAM_TPI.types[t].leaf_type != "LF_PROCEDURE":
        continue
    formalparams = [ get_type_name(tp)\
        for tp in pdb.STREAM_TPI.types[t].arglist.arg_type ]
    print(hex(t), pdb.STREAM_TPI.types[t].call_conv,\
          get_type_name(pdb.STREAM_TPI.types[t].return_type),\
          "(", ", ".join(formalparams), ")")
The script given above can be used to list function prototypes defined in the TPI stream (we limit our discussion to global functions while member and static functions are left for another time) with the following result:
1
2
3
4
5
6
7
8
9
0x1343 NEAR_C T_VOID ( T_64PVOID )
0x135d NEAR_C T_64PVOID (  )
0x1365 NEAR_C T_INT4 (  )
0x13f3 NEAR_C UNKNOWN ( _EXCEPTION_RECORD*, T_64PVOID, _CONTEXT*, T_64PVOID )
0x149b NEAR_C T_VOID ( _TP_CALLBACK_INSTANCE*, T_64PVOID )
0x14a2 NEAR_C T_VOID ( T_64PVOID, T_64PVOID )
0x1551 NEAR_C T_HRESULT ( tagEXCEPINFO* )
0x16fb NEAR_C T_ULONG ( TextHolder*, const T_WCHAR* )
[…]
These prototypes include everything one could ever wish for: calling conventions, types of return values, types of formal parameters. Everything but names! If only a function name were known one could obtain a half-descent output with the help of a little routine like the one below.
1
2
3
4
5
6
7
8
9
10
11
12
13
14
15
def print_function_declaration_from_tpi_by_idx(pdb, fname, typind):
    if not typind in pdb.STREAM_TPI.types:
        print("There is no record with the index",\
            typind, "in the TPI stream")
        return
    #not dealing with static and member functions
    if pdb.STREAM_TPI.types[typind].leaf_type != "LF_PROCEDURE":
        print("The type at", typind, "is not a fuction, but",\
            pdb.STREAM_TPI.types[typind].leaf_type)
        return
    formalparams = [ get_type_name(tp) for tp in\
            pdb.STREAM_TPI.types[typind].arglist.arg_type ]
    print(pdb.STREAM_TPI.types[typind].call_conv, " ",\
        get_type_name(pdb.STREAM_TPI.types[typind].return_type), " ",\
        fname, "(", ", ".join(formalparams), ")", sep="")
Having been confronted with a problem of connecting a symbol to its record in a TPI stream for the second time, I knew exactly what to do. Never again will I be unhinged by an apparent lack of connections in a pdb file! Recall the symbols that, despite being present in the global symbol stream, had been ignored by the parser; among them were symbols with the attribute leaf_type equal to 0x1125 (S_PROCREF, “reference to procedure”). Why do we not parse them?
1
2
3
4
5
6
7
8
9
10
11
12
13
gsym = Struct(
    "leaf_type" / Int16ul, "data" / Switch(
        lambda ctx: ctx.leaf_type, {
#[…]
            0x1125: #adapted from struct REFSYM2 defined in cvinfo.h
            "proc_ref" / Struct(
                "sumname" / Int32ul,
                "offset" / Int32ul,
                "iMod" / Int16ul,
                "name" / CString(encoding = "utf8"),
            ),
#[…]
        }))
Applying the newly added construct, we get:
1
2
3
4
5
>>> print(*[ (s.name, s.iMod, hex(s.offset)) for s in pdb.STREAM_GSYM.globals\
...     if s.leaf_type == 0x1125 ], sep="\n")
[...]
('store_message', 3, '0x440')
('main', 3, '0x4e8')
At that point the situation did not look staggeringly promising. Yes, I found symbols for store_message() and the only other function in my source code – main(), but none of them referenced TPI steam. All that I could safely deduce was that something pertaining to the function in question resided in a module with index 3, at an offset of 0x440. Perplexed, I decided to abandon the current lead and run a file-wide search for strings.
1
2
3
4
$ find -name "hiworld.pdb.*" -type f -print0 | xargs -0 strings -f | grep store_message
./hiworld.pdb.014: store_message
./hiworld.pdb.008: ?store_message@@YAKPEAUTextHolder@@PEB_W@Z
./hiworld.pdb.008: store_message
We already know that identified by the index = 8 is a global symbols stream; within the stream, there are two relevant symbols with leaf_types S_PUB32 (and a mangled name) and S_PROCREF. What about stream number 14? Could it somehow correspond to the module pointed to by iMod = 3?
Well, under normal circumstances, 14 is not equal to 3, but it is not the reason to get disheartened. The notion of module and what LLVM documentation calls a “compiland” are, in all probability, one and the same. In this case DBI stream is where one should look for clues. After some pocking around I found this:
1
2
>>> pdb.STREAM_DBI.DBIExHeaders[2]
Container(opened=0, range=Container(section=2, offset=1680, size=130, flags=1615859744, module=2, dataCRC=3438623728, relocCRC=1000694769), flags=2, stream=14, symSize=1336, oldLineSize=0, lineSize=504, nSrcFiles=16, offsets=25059472, niSource=56, niCompiler=12, modName=u'C:\\Temp\\hiworld\\hiworld\\x64\\Debug\\hiworld.obj', objName=u'C:\\Temp\\hiworld\\hiworld\\x64\\Debug\\hiworld.obj')
I guess the module number (3 vs. 2) discrepancy is due to the fact that iMod counts modules starting from one whereas DBIExHeaders indices are zero-based… What should really capture our attention here is the attribute stream with a value of 14. Why do we not peer inside the mysterious 14th stream?
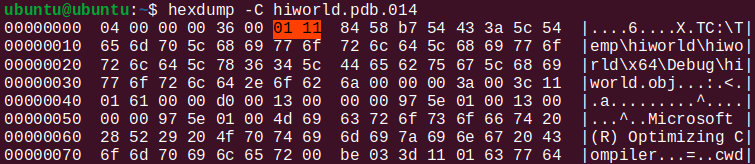
It seems to have the same structure as the rest of them, with records preceded by their lengths and types. Look! There is S_OBJNAME = 0x1101 (“path to object file name”) magic number from Microsoft’s cvinfo.h and what follows, indeed, looks very much like a path to an object file. Let us scroll down to the offset specified by message_store’s “global” symbol (0x440).
To all appearances, we are about to deal with a 0x0036 bytes-long record of type S_GPROC32 (0x1110), otherwise known as “global procedure start.” The matching C++ structure is given below.
1
2
3
4
5
6
7
8
9
10
11
12
13
14
15
typedef struct PROCSYM32 {
    unsigned short  reclen;     // Record length
    unsigned short  rectyp;     // S_GPROC32, S_LPROC32, S_GPROC32_ID, S_LPROC32_ID, S_LPROC32_DPC or S_LPROC32_DPC_ID
    unsigned long   pParent;    // pointer to the parent
    unsigned long   pEnd;       // pointer to this blocks end
    unsigned long   pNext;      // pointer to next symbol
    unsigned long   len;        // Proc length
    unsigned long   DbgStart;   // Debug start offset
    unsigned long   DbgEnd;     // Debug end offset
    CV_typ_t        typind;     // Type index or ID
    CV_uoff32_t     off;
    unsigned short  seg;
    CV_PROCFLAGS    flags;      // Proc flags
    unsigned char   name[1];    // Length-prefixed name
} PROCSYM32;
Do you see what I see? The typind field! It appears to be a conventional name for an index in the TPI stream. Armed with this knowledge, I wrote a little python script that, given a name, would find and print out a prototype for a function with this name employing the same technique for parsing data as pdbparse had done. Here it is.
1
2
3
4
5
6
7
8
9
10
11
12
13
14
15
16
17
18
19
20
21
22
23
24
25
26
27
28
29
30
31
import construct as cs
GlobalProcSym = "PROCSYM32" / cs.Struct(
        "reclen" / cs.Int16ul,
        "rectyp" / cs.Int16ul,
        "pParent" / cs.Int32ul,
        "pEnd" / cs.Int32ul,
        "pNext" / cs.Int32ul,
        "len" / cs.Int32ul,
        "DbgStart" / cs.Int32ul,
        "DbgEnd" / cs.Int32ul,
        "typind" / cs.Int32ul,
        "offset" / cs.Int32ul,
        "seg" / cs.Int16ul,
        "flags" / cs.Int8ul,
        "name" / cs.CString(encoding = "utf8"),
    )

def print_function_declaration_from_tpi(pdb, fname):
    fncs = list(filter(lambda s: s.leaf_type == S_PROCREF and\
        s.name == fname, pdb.STREAM_GSYM.globals))
    if len(fncs) == 0:
        print("There is no S_PROCREF-type reference to",\
            fname, "in the global symbols stream.")
        return
    #Indices given by iMod are 1-based while pdb.STREAM_DBI.DBIExHeaders[]
    #is a standard python list with 0-based indexing
    data = pdb.streams[pdb.STREAM_DBI.DBIExHeaders[\
                fncs[0].iMod -1].stream].data
    fn = GlobalProcSym.parse(data[fncs[0].offset:],\
             entry_offest = fncs[0].offset)
    print_function_declaration_from_tpi_by_idx(pdb, fname, fn.typind)
First it looks for a “reference to procedure” record in the global symbols streams then uses its fields iMod and offset to locate a module stream and region of memory within it which is later parsed with construct. Take a look at print_function_declaration_from_tpi in action.
1
2
>>> print_function_declaration_from_tpi(pdb, "store_message")
NEAR_C T_ULONG store_message(TextHolder*, const T_WCHAR*)
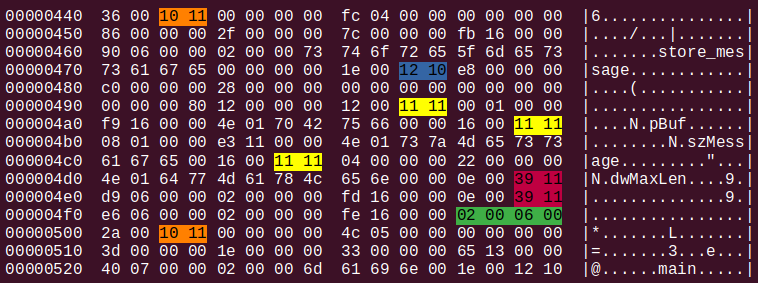
What is wrong with this declaration (apart from the obscure calling convention name)? Nothing is wrong: this is a perfectly acceptable prototype, however one cannot help but feel it could be fairly improved by adding names for formal parameters. The reason why this feeling arises is because names of formal parameters are up for grabs, clearly visible, in the stream dump; one only needs to infer the internal organization. It is easy to spot magic numbers of the form 0x11?? and 0x10?? scattered all over the region between “store_message” and “main” strings (with the latter obviously designating a boundary of the relevant chunk of memory). I have copypasted corresponding definitions for your following-the-line-of-discussion pleasure.
1
2
3
4
5
6
7
8
typedef enum SYM_ENUM_e {
[...]
    S_CALLSITEINFO = 0x1139, // Indirect call site information
    S_FRAMEPROC = 0x1012, // extra frame and proc information
    S_REGREL32 = 0x1111, // register relative address
    S_END = 0x0006
[...]
};
So PROCSYM32 is immediately followed by some extra stack frame information and zero or more register-relative addresses, one for each function parameter and local variable, then goes a list of call sights. I declared “constructs” for each of these entities in case they would be needed in the future (following the definitions found in cvinfo.h). Here we go.
1
2
3
4
5
6
7
8
9
10
11
12
13
14
15
16
17
18
19
20
21
22
23
24
25
26
27
ProcFrameData = cs.Struct(
    "rectyp" / cs.Enum(cs.Int16ul, S_FRAMEPROC = 0x1012, S_CALLSITEINFO = 0x1139, S_REGREL32 = 0x1111),
    "reminder" / cs.Switch(
    lambda ctx: ctx.rectyp, {
        "S_FRAMEPROC":
        "FRAMEPROCSYM" / cs.Struct(
            "cbFrame" / cs.Int32ul,
            "offPad" / cs.Int32ul,
            "cbSaveRegs" / cs.Int32ul,
            "offExHdlr" / cs.Int16ul,
            "flags" / cs.Int32ul,
        ),
        "S_REGREL32":
        "REGREL32" / cs.Struct(
            "off" / cs.Int32ul,
            "typind" / cs.Int32ul,
            "reg" / cs.Int16ul,
            "name" / cs.CString(encoding = "utf8"),
        ),
        "S_CALLSITEINFO":
        "CALLSITEINFO" / cs.Struct(
            "off" / cs.Int32ul,
            "sect" / cs.Int16ul,
            "__reserved_0" / cs.Int16ul,
            "typind" / cs.Int32ul,
        ),
    }))
One cannot determine with certainty whether this list is exhaustive or not, but luckily, there is no need to do so as the “length” field allows for record skipping, which, in turn, is implemented with the help of RestreamData class. Thanks to GreedyRange a sequence of an arbitrary number of REGREL32 and CALLSITEINFO instances, as many as can fit into the given region of memory, is parsed.
1
2
3
4
5
6
7
ProcFrameEntries = cs.GreedyRange(
    cs.Struct(
        "reclen" / cs.Int16ul,
        "frame_entry" / cs.RestreamData(cs.Bytes(lambda ctx: ctx.reclen),\
            ProcFrameData),
    )
)
Now we have to “confine” the chunk of stream parsed by ProcFrameEntries, i.e determine where the data relating to store_message() end and main()’s PROCSYM32 structure begins. It turns out, pEnd field (in PROCSYM32 structure) points to the data immediately following the last instance of CALLSITEINFO. In our case, it is a 32-bit value 0x00060002 whose meaning I have not been able to figure out. Obviously, it is an end-of-something marker(s), what is more, the constant S_END = 0x0006 is documented in the Microsoft’s header; as for 0x0002, however, I have not found anything meaningful in the current context. But does it even matter?
1
2
3
4
5
6
7
8
9
10
11
12
13
14
15
16
17
18
19
20
21
22
23
24
25
26
27
28
29
GlobalProc = cs.Struct(
    "PROCSYM32" / cs.Struct(
            "reclen" / cs.Int16ul,
            "rectyp" / cs.Int16ul,
            "pParent" / cs.Int32ul,
            "pEnd" / cs.Int32ul,
            "pNext" / cs.Int32ul,
            "len" / cs.Int32ul,
            "DbgStart" / cs.Int32ul,
            "DbgEnd" / cs.Int32ul,
            "typind" / cs.Int32ul,
            "offset" / cs.Int32ul,
            "seg" / cs.Int16ul,
            "flags" / cs.Int8ul,
            "name" / cs.CString(encoding = "utf8"),
    ),
    #making sure the entire length of PROCSYM32 has been parsed
    cs.Padding(lambda ctx: ctx.PROCSYM32.reclen +\
        cs.Int16ul.sizeof() - ctx._io.tell()),
    "frame_data" / cs.RestreamData(
        # ctx.PROCSYM32.pEnd points to the region immediately following
        #the last element of ProcFrameEntries;
        # ctx.PROCSYM32.reclen does not include the reclen field
        #hence the cs.Int16ul.sizeof() correction
        cs.Bytes(lambda ctx: ctx.PROCSYM32.pEnd - ctx._params.entry_offest -\
            ctx.PROCSYM32.reclen - cs.Int16ul.sizeof()),
        ProcFrameEntries
    )
)
One more problem must be taken care of before we can write down the final variant of print_function_declaration() routine. Given the way constructs are declared, elements of ProcFrameEntries will have a nested structure:
1
2
3
4
5
6
7
8
9
10
{
    reclen
    frame_entry {
      rectyp
      reminder {
          cbFrame
          ...
      }
   }
}
which needs to be flattened for convenience.
1
2
3
4
5
6
7
8
9
10
11
12
def flatten_frame_data(cont):
    fd = cs.lib.ListContainer()
    for c in cont:
        dc = cs.lib.Container()
        dc["reclen"] = c.reclen
        dc["rectyp"] = c.frame_entry.rectyp
        for k in c.frame_entry.reminder:
            if k.startswith("_"):
                continue
            dc[k] = c.frame_entry.reminder[k]
        fd.append(dc)
    return fd
Interestingly, I could not find a way of distinguishing between REGREL32 instances for function arguments and local variables. Inasmuch as the former seem to always come first and in order, an end-of-argument-list marker would be helpful (and such a value even appears to be defined in cvinfo.h: S_ENDARG = 0x000a) but, when examining the stream dump, it is nowhere to be found. Therefore, assuming that the function’s formal parameters always come first and are listed in order from first to last, I simply use the “number of arguments” value from the TPI stream. This method is not guaranteed to work for all calling conventions and the case of variable number of arguments is not handled either. It is a long way to go before this implementation could be deemed “production-ready”.
What is a list of REGREL32s good for? As it was already mentioned, REGREL32 represents an address of a variable/function argument relative to some register, thus making it possible to locate it on a call stack, which is of no interest to us at the moment. What is interesting is that it contains a TPI index and parameter/variable name except for the cases when the said parameter/variable is of a primitive type. Primitive types do not have records in TPI stream, being identified by numeric constants instead. These constants turn into base_type enums (defined in pdbparse.tpi namespace) as they are parsed by pdpbarse and this is the form they are expected to take by the get_type_name() function I implemented earlier. Thus, we must mimic this step in order to obtain a string representation for any type.
Putting it all together, we get:
1
2
3
4
5
6
7
8
9
10
11
12
13
14
15
16
17
18
19
20
21
22
23
24
25
26
27
28
from pdbparse import tpi
def print_function_declaration_from_mods_stream_named_params(pdb, fname):
    fncs = list(filter(lambda s: s.leaf_type == S_PROCREF and\
        s.name == fname, pdb.STREAM_GSYM.globals))
    if len(fncs) == 0:
        print("There is no S_PROCREF-type reference to", fname,\
            "in the global symbols stream.")
        return

    data = pdb.streams[pdb.STREAM_DBI.DBIExHeaders[\
        fncs[0].iMod - 1].stream].data
    fn = GlobalProc.parse(data[fncs[0].offset:], entry_offest = fncs[0].offset)
    if not fn.PROCSYM32.typind in pdb.STREAM_TPI.types:
        print("There is no type record for", fname,\
            "( PROCSYM32.typind =", fn.PROCSYM32.typind, ") in the TPI stream")
        return

    tp = pdb.STREAM_TPI.types[fn.PROCSYM32.typind]
    paramcnt = tp.arglist.count
    paramregs = list(filter(lambda k: k.rectyp == "S_REGREL32",\
        flatten_frame_data(fn.frame_data)))[0:paramcnt]
    params = [ get_type_name(pdb.STREAM_TPI.types[e.typind]\
        if e.typind in pdb.STREAM_TPI.types\
        else tpi.base_type.parse(e.typind.to_bytes(16, byteorder='little'))) +\
            " " + e.name for e in paramregs ]

    print(tp.call_conv, " ", get_type_name(tp.return_type), " ",\
        fname, "(", ", ".join(params), ")", sep = "")
Finally, I may rejoice in admiring the fruits of my labour. Join and behold! He-he.
1
2
3
>>> print_function_declaration_from_mods_stream_named_params(pdb,\
... "store_message")
NEAR_C T_ULONG store_message(TextHolder* pBuf, const T_WCHAR* szMessage)
Farewell
The bits of source code scattered throughout the text (excluding changes in pdbparse itself) are collected here.
I hope this little post has saved you an hour or two of pocking around in the hex dumps and source code. As for me, it gave me an opportunity to demonstrate useful reverse engineering techniques in way of sharing tricks of the trade, so to speak.
– Ry Auscitte
References:
- Program Database, Wikipedia, available at: https://en.wikipedia.org/wiki/Program_database
- Jeremy Gordon, The RSDS pdb format, available at http://www.godevtool.com/Other/pdb.htm
- Oleg Starodumov, Generating debug information with Visual C++ , available at http://www.debuginfo.com/articles/gendebuginfo.html
- Oleg Starodumov, Matching Debug Information, available at http://www.debuginfo.com/articles/debuginfomatch.html
- Krzysztof Kowalczyk, pdb format, available at: https://blog.kowalczyk.info/article/4ac18b52d1c4426185d0d69058ff9a62/pdb-format.html
- Information from Microsoft about pdb format, available at: https://github.com/Microsoft/microsoft-pdb
- LLVM Compiler Infrastructure: The PDB File Format, available at: https://llvm.org/docs/PDB/index.html
- MSVC Compiler Reference: /Z7, /Zi, /ZI (Debug Information Format), available at https://docs.microsoft.com/en-us/cpp/build/reference/z7-zi-zi-debug-information-format
- Sven B. Schreiber, 2001, Undocumented Windows 2000 secrets: a programmer’s cookbook, Addison-Wesley Longman Publishing Co., Inc., USA.